Inside PacketLens: how we use nDPI for real-time application visibility
How PacketLens layers nDPI deep packet inspection with TLS SNI product detection and passive DNS verification to classify over 99% of live network flows — with live Grafana screenshots from a real wifi capture.
Deep packet inspection feels like a solved problem until you sit in front of a real network and try to answer one question: what is actually flowing through it, right now? Most connections are TLS. QUIC is taking over from TCP. SNI is about to be encrypted by Encrypted Client Hello. Port 443 means nothing. A signature-only DPI engine staring at this traffic will shrug at half of it.
PacketLens answers that question by layering four signals on top of each other — classic DPI, port heuristics, TLS SNI, and passive DNS. Each one catches what the previous one missed. The result is a live Grafana dashboard where, on a normal laptop’s wifi interface, less than one percent of flows end up labelled “unknown”.
At a glance
- What it is: PacketLens is an open-source deep packet inspection and observability stack for FD.io VPP, built on top of nDPI (450+ protocols, LGPL).
- How it classifies: four stages — nDPI signatures, port/heuristic giveup, TLS SNI override, and passive DNS verification — each correcting or sharpening the previous.
- What it produces: per-flow labels (app, category, method) exported as Prometheus metrics from VPP’s stats segment, with a ready-made Grafana dashboard.
- Measured on live wifi: under 1% of flows unclassified, with AI products like Claude, ChatGPT, and Gemini correctly identified via their plaintext TLS SNI.
- Performance target: under 8 ns of overhead per cached packet, inline on the VPP forwarding path — no mirror port, no separate appliance.
This post is a tour of that pipeline and the dashboard it drives. Every screenshot below was taken minutes ago on a regular home wifi connection, while Playwright drove a browser through YouTube, Claude, ChatGPT, Gemini, GitHub, Spotify, Cloudflare, Netflix, Hacker News, and Reddit.
Why nDPI
nDPI is the deep packet inspection library behind ntopng, Suricata, pfSense, Arkime, and a long list of other network tools. It ships signatures for roughly 450 protocols and applications — HTTP, DNS, TLS, QUIC, SIP, RTP, SSH, BitTorrent, Zoom, YouTube, Netflix, Spotify, a hundred SaaS products, all the way down to obscure gaming protocols. It’s LGPL-licensed, maintained by ntop, and fast: classification for a single flow typically converges in the first three to eight packets.
What nDPI alone cannot do:
- Recognise every new SaaS that launched last week. Its signature database ships updates, but there’s always a lag.
- Tell you which product inside a shared platform a flow belongs to. A TLS connection to Google might be YouTube, Gmail, Drive, Meet, or Gemini — all of those are “Google” to the TLS stack.
- Survive when the traffic has no distinguishable fingerprint — generic CDN-fronted TLS looks like generic CDN-fronted TLS whether it’s carrying a corporate intranet or an obscure AI service.
PacketLens treats nDPI as the foundation and then refines its verdicts with cheap, passive signals that the flow itself is already giving away.
The classification pipeline
flowchart LR
  P[New flow / first packets] --> D{nDPI DPI}
  D -- match --> S[SNI / DNS<br/>override check]
  D -- no match --> G{Port / heuristic<br/>giveup}
  G --> S
  S --> CLASS[Final verdict]
  CLASS --> M[Prometheus metrics<br/>per app · category · method]
Four stages, applied in order:
- nDPI DPI. The first handful of packets of every flow go to nDPI. If there’s a signature match, we have an app name and a category.
- Port / heuristic giveup. If nDPI can’t match after its usual threshold, it falls back to port-based and heuristic guesses — “this is TLS”, “this is probably DNS”, “this looks like SIP on 5060”.
- SNI override. If the flow is TLS and we caught the ClientHello, we have a plaintext hostname. We match that hostname against a curated list of product domains and override the verdict when we find one. This is how a generic “TLS” flow becomes
Claude. - DNS cross-check. In parallel, a passive DNS observer watches every A response on the wire and maintains an IP→hostname cache. When a flow hits a destination IP whose hostname we already saw resolved, we use that hostname as independent corroboration of the nDPI verdict.
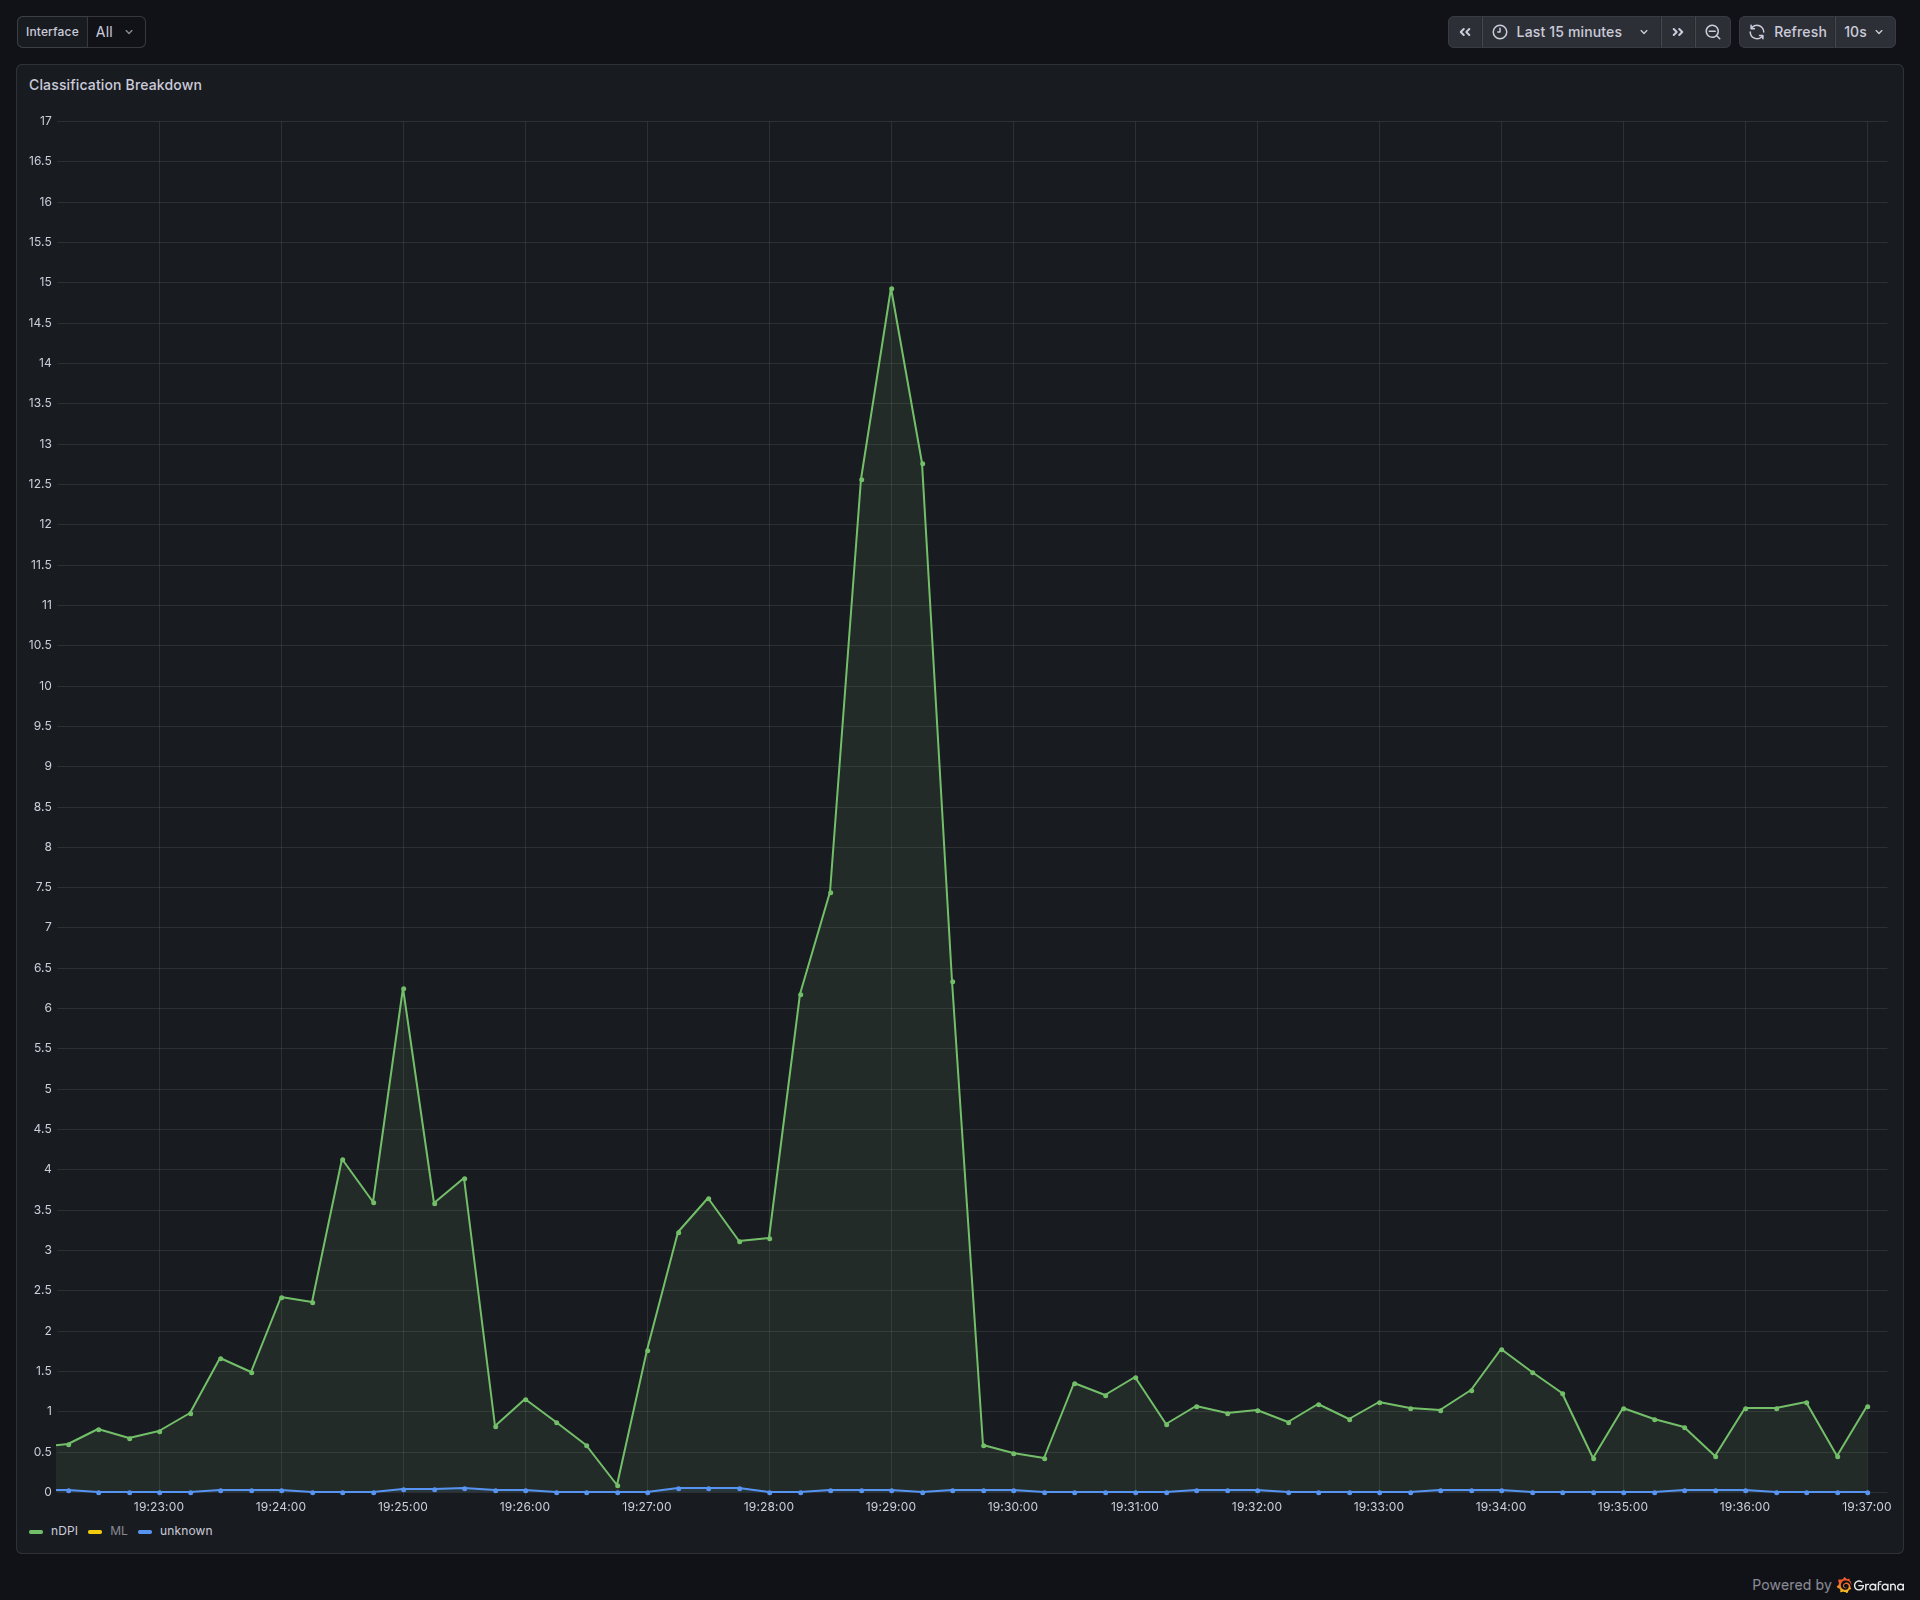
The key property is that each stage can both sharpen (turn “TLS” into “Claude”) and correct (turn “Google” into “YouTube” when the destination IP is a googlevideo CDN). Every flow is tagged with which method ultimately produced its verdict, and that tag is exposed as a Prometheus label so the dashboard can break it down.
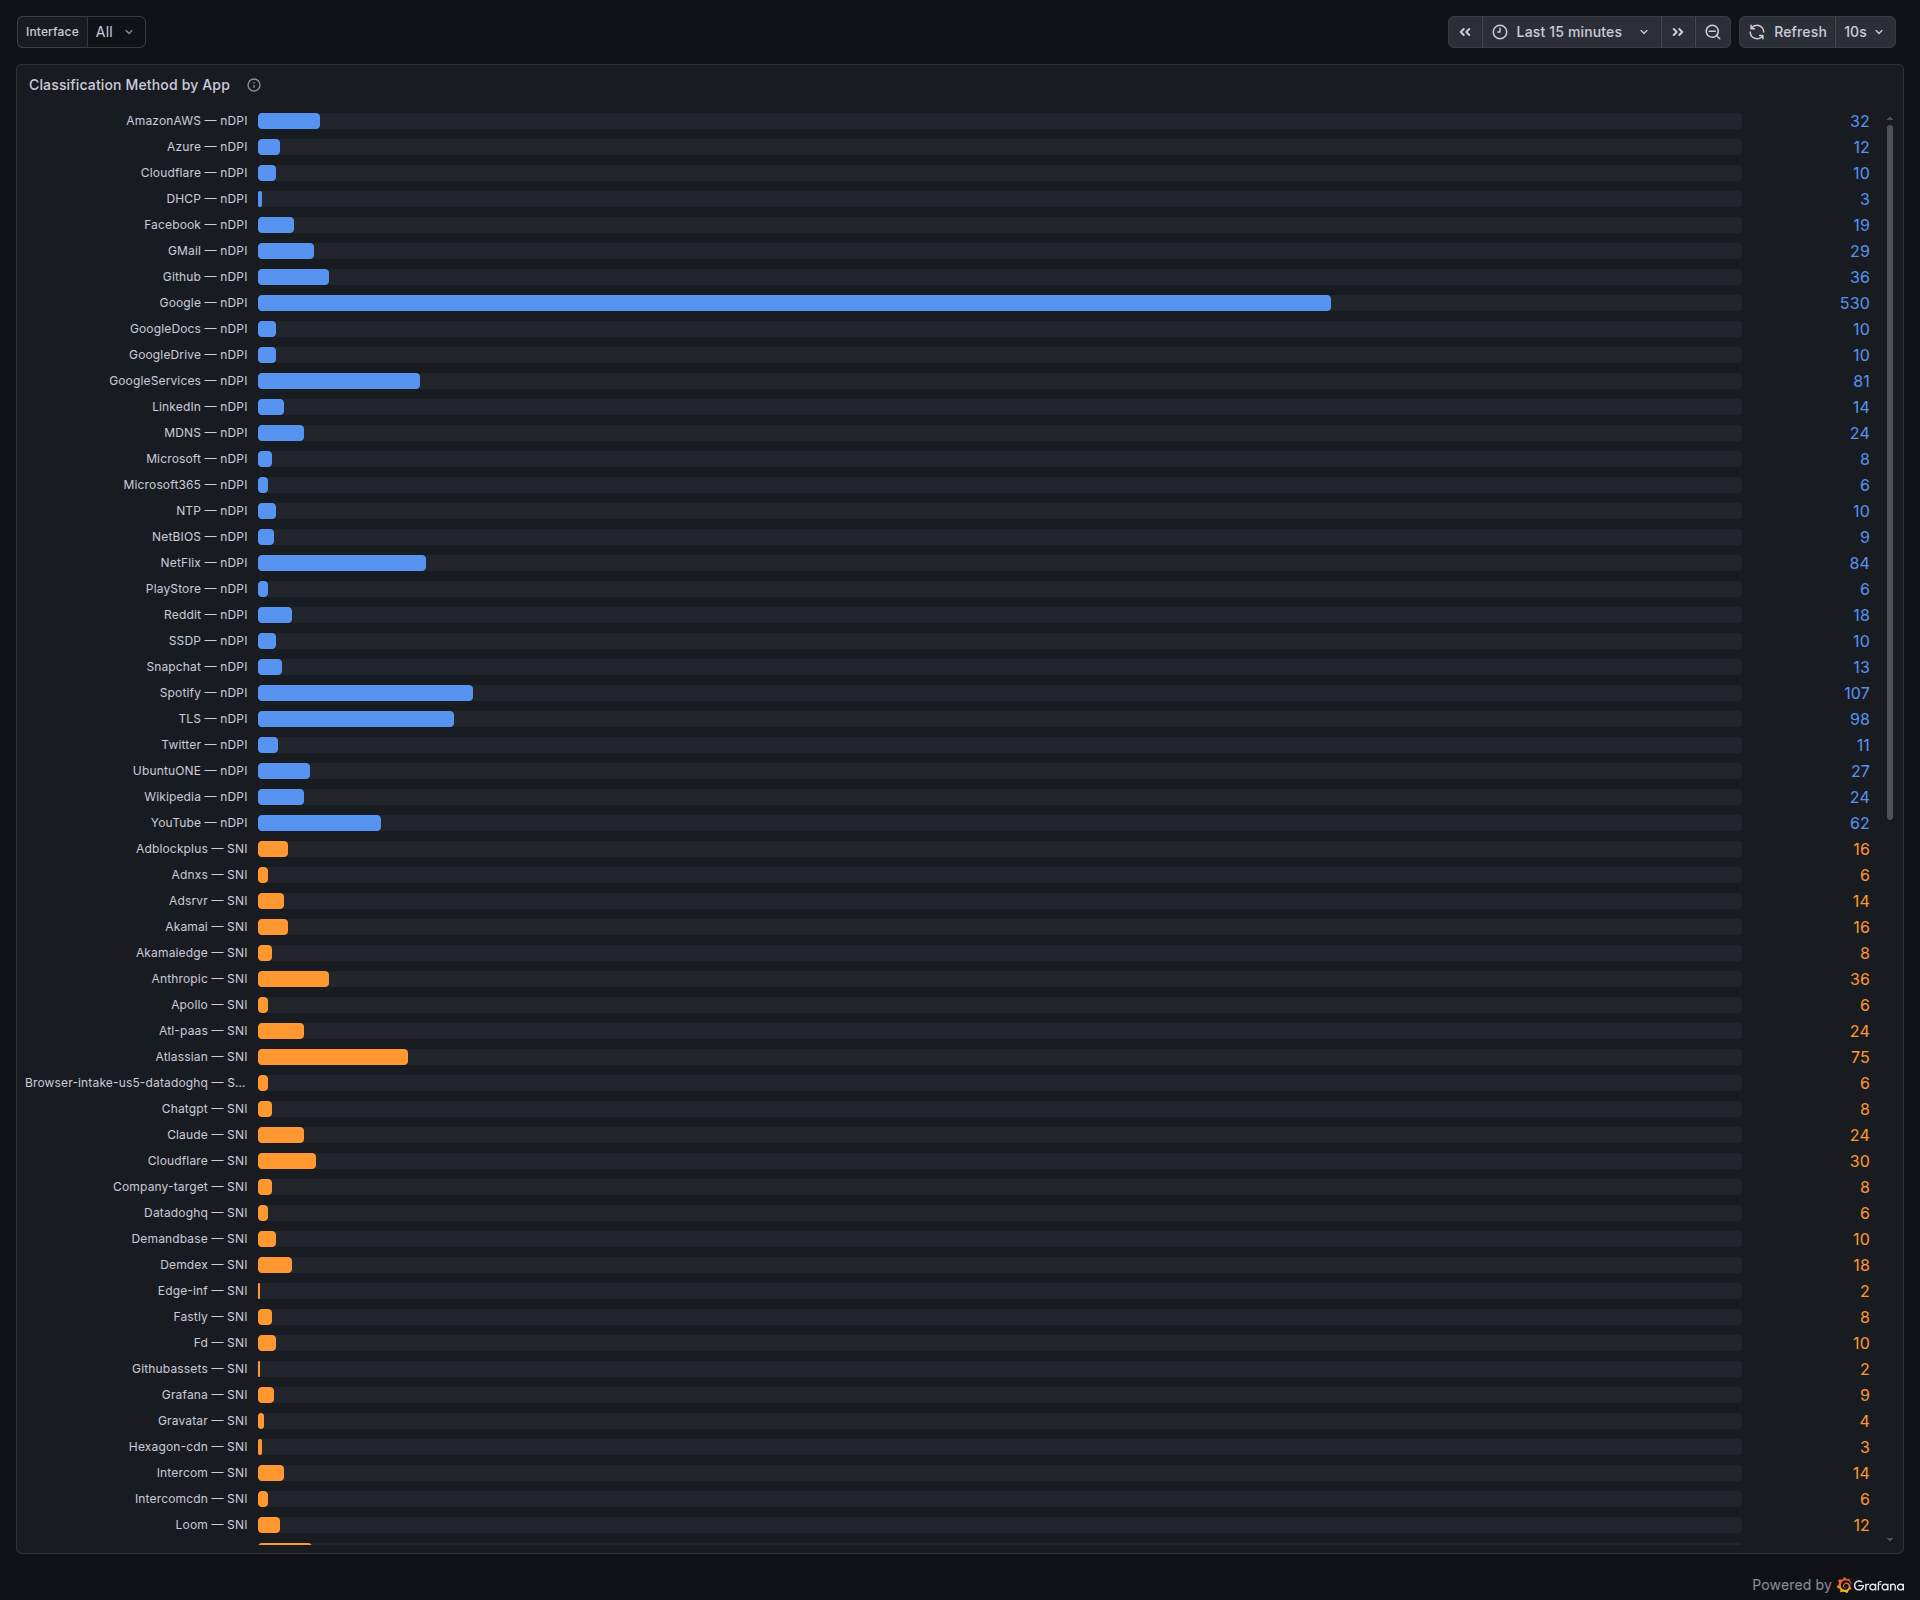
Look at the orange (SNI) section. Anthropic — SNI: 36, Chatgpt — SNI: 8, Claude — SNI: 24, Atlassian — SNI: 75, Loom — SNI: 12. None of these had nDPI signatures that matched during the capture — they’re TLS flows to cloud-fronted infrastructure. Without the SNI stage they’d all sit in the TLS bucket. With it, they show up as distinct products in the dashboard.
SNI extraction and product detection
For today’s TLS 1.2 and 1.3 traffic, the Server Name Indication field in the ClientHello is sent in clear. nDPI already parses the ClientHello — PacketLens takes the SNI out of that parse and runs it through a match table of product domains.
The table covers, for example:
- AI products —
anthropic.com,claude.ai,openai.com,chatgpt.com,oai.azure.com,gemini.google.com,generativelanguage.googleapis.com,aistudio.google.com,copilot.microsoft.com,perplexity.ai,grok.x.ai,mistral.ai. - MCP endpoints — the Model Context Protocol rides over SSE-encrypted TLS, so flows are invisible to DPI. But the SNI gives away which MCP server is being used:
api.github.com→GitHub_MCP,api.anthropic.com→Claude_MCP,mcp.linear.app→Linear_MCP, and so on. - Developer SaaS, productivity, collaboration tools — Atlassian, Loom, Intercom, Grafana, Datadog, and dozens more.
When the SNI doesn’t match anything in the curated list but clearly names a product, PacketLens also auto-allocates a numeric app ID for it and records the label. Over time this produces a live inventory of whatever SaaS tools are actually crossing the wire:
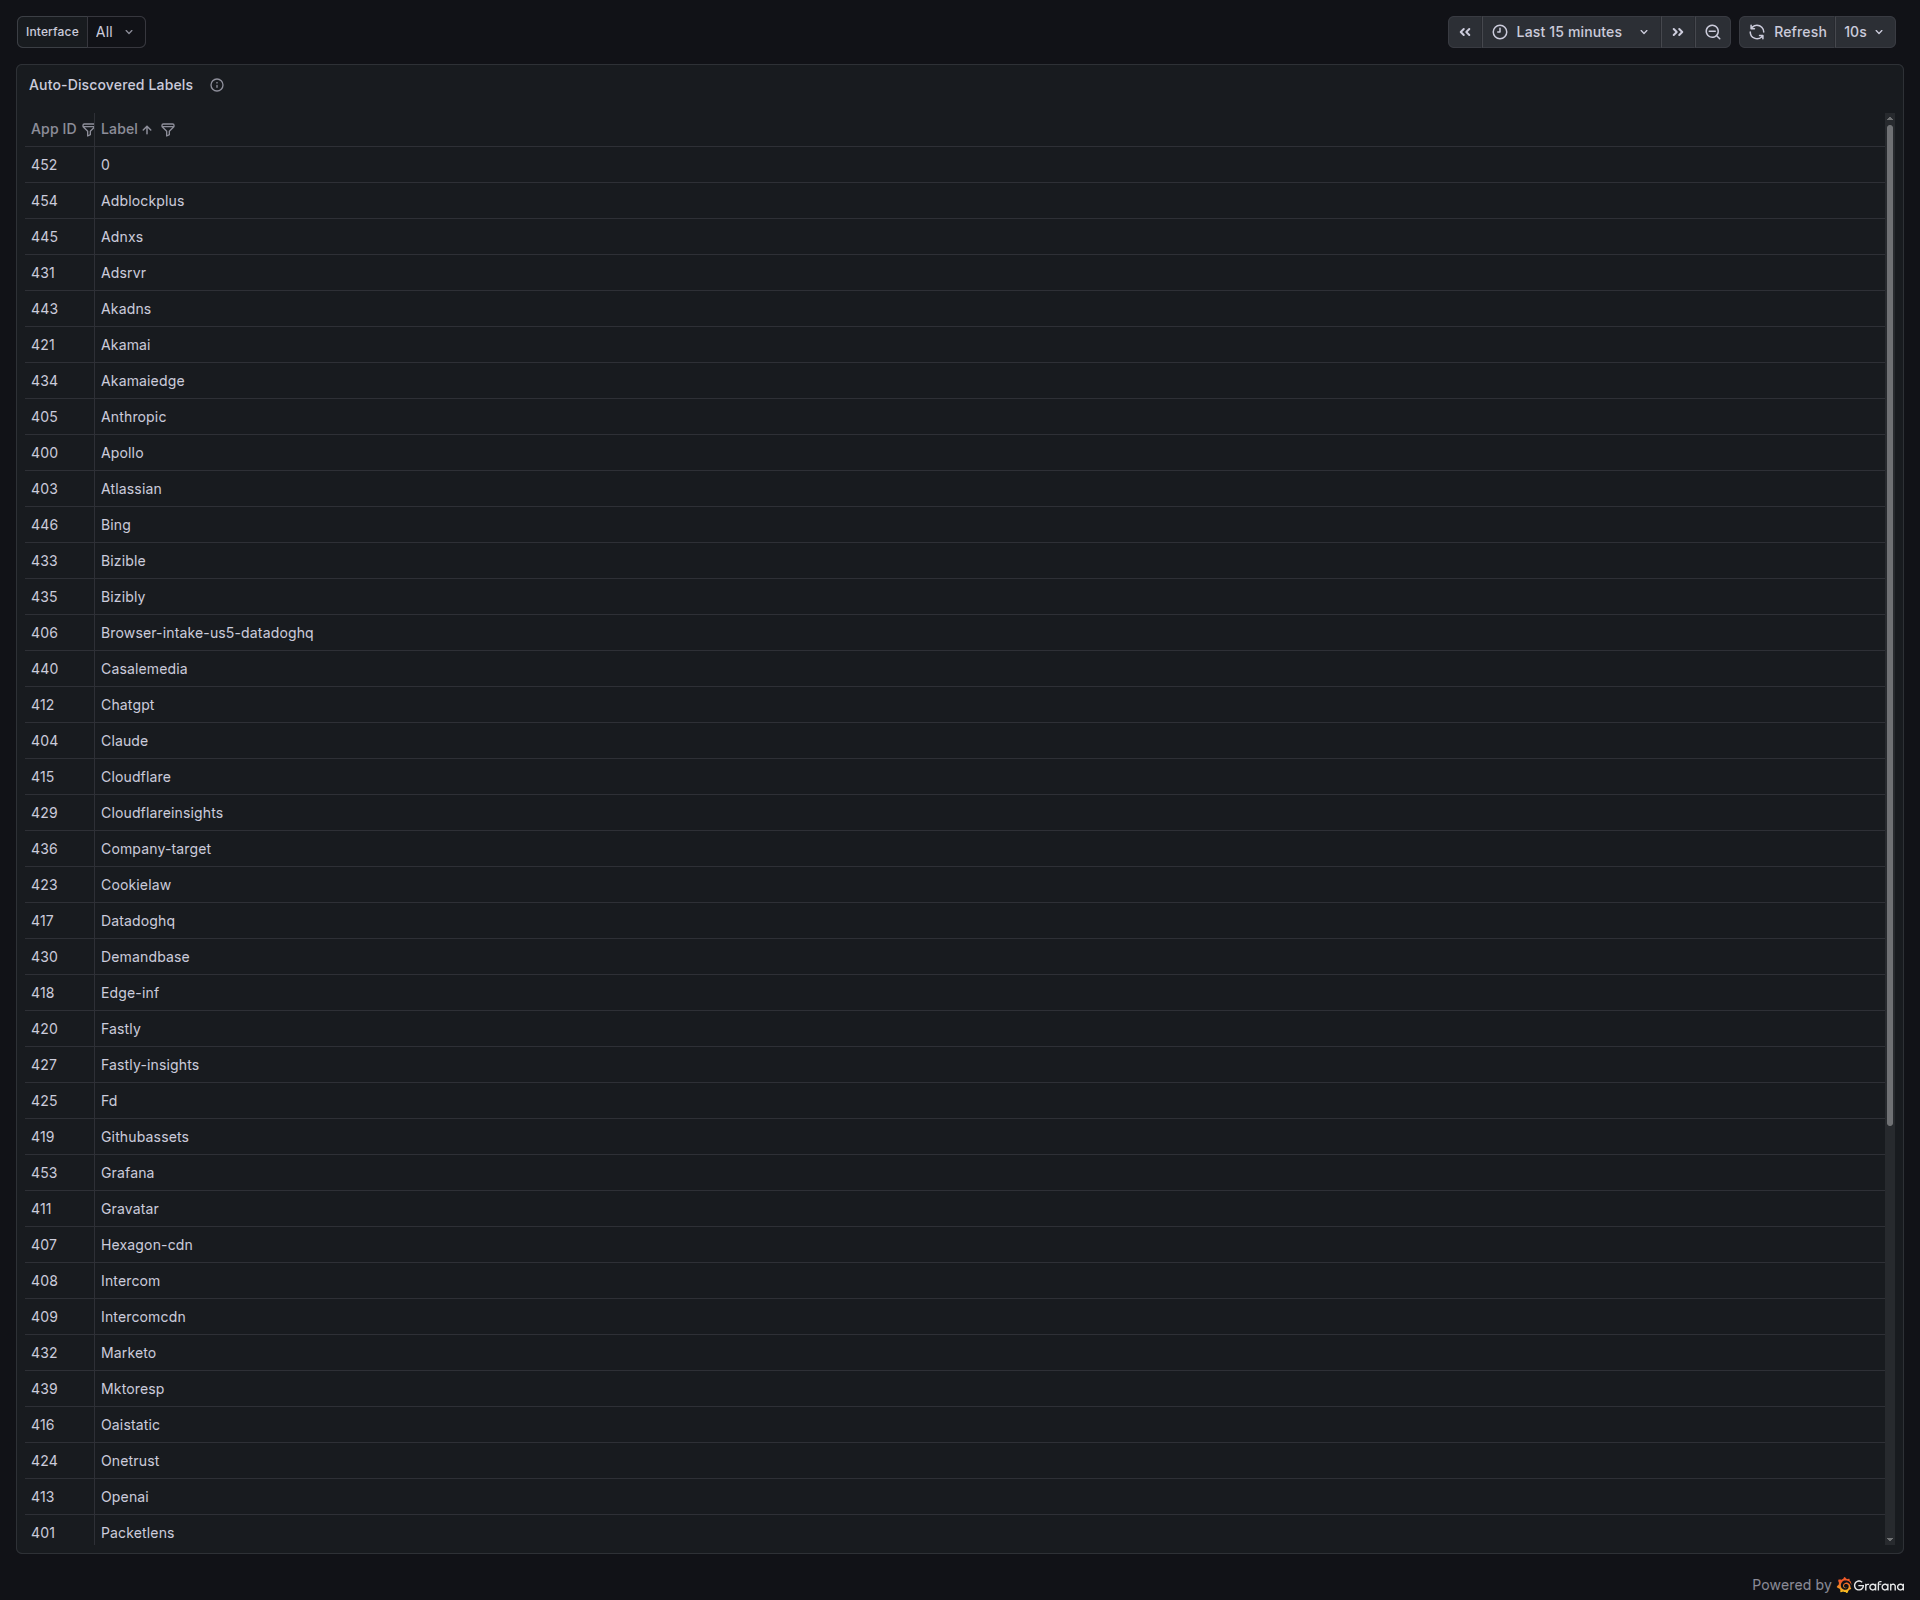
Every row in that table is a product that the daemon saw at least once, with a stable numeric ID. The next time a flow lands on one of these SNIs, it’s attributed to the right label without any extra work.
Passive DNS verification
SNI helps when the ClientHello is in clear. What about flows where the handshake is further along by the time classification starts, or flows where the SNI is absent — QUIC without ECH, raw TLS-over-SCTP, bare TCP to a known CDN IP? That’s where the DNS cache earns its keep.
sequenceDiagram
  participant Client
  participant Resolver
  participant Classifier as nDPI classifier
  Client->>Resolver: A? www.youtube.com
  Resolver-->>Client: A 142.250.80.78
  Note over Classifier: observes response,<br/>caches IP→hostname
  Client->>YouTube: TLS handshake to 142.250.80.78
  Note over Classifier: nDPI sees generic TLS<br/>→ cache says googlevideo.com<br/>→ flow labeled YouTube
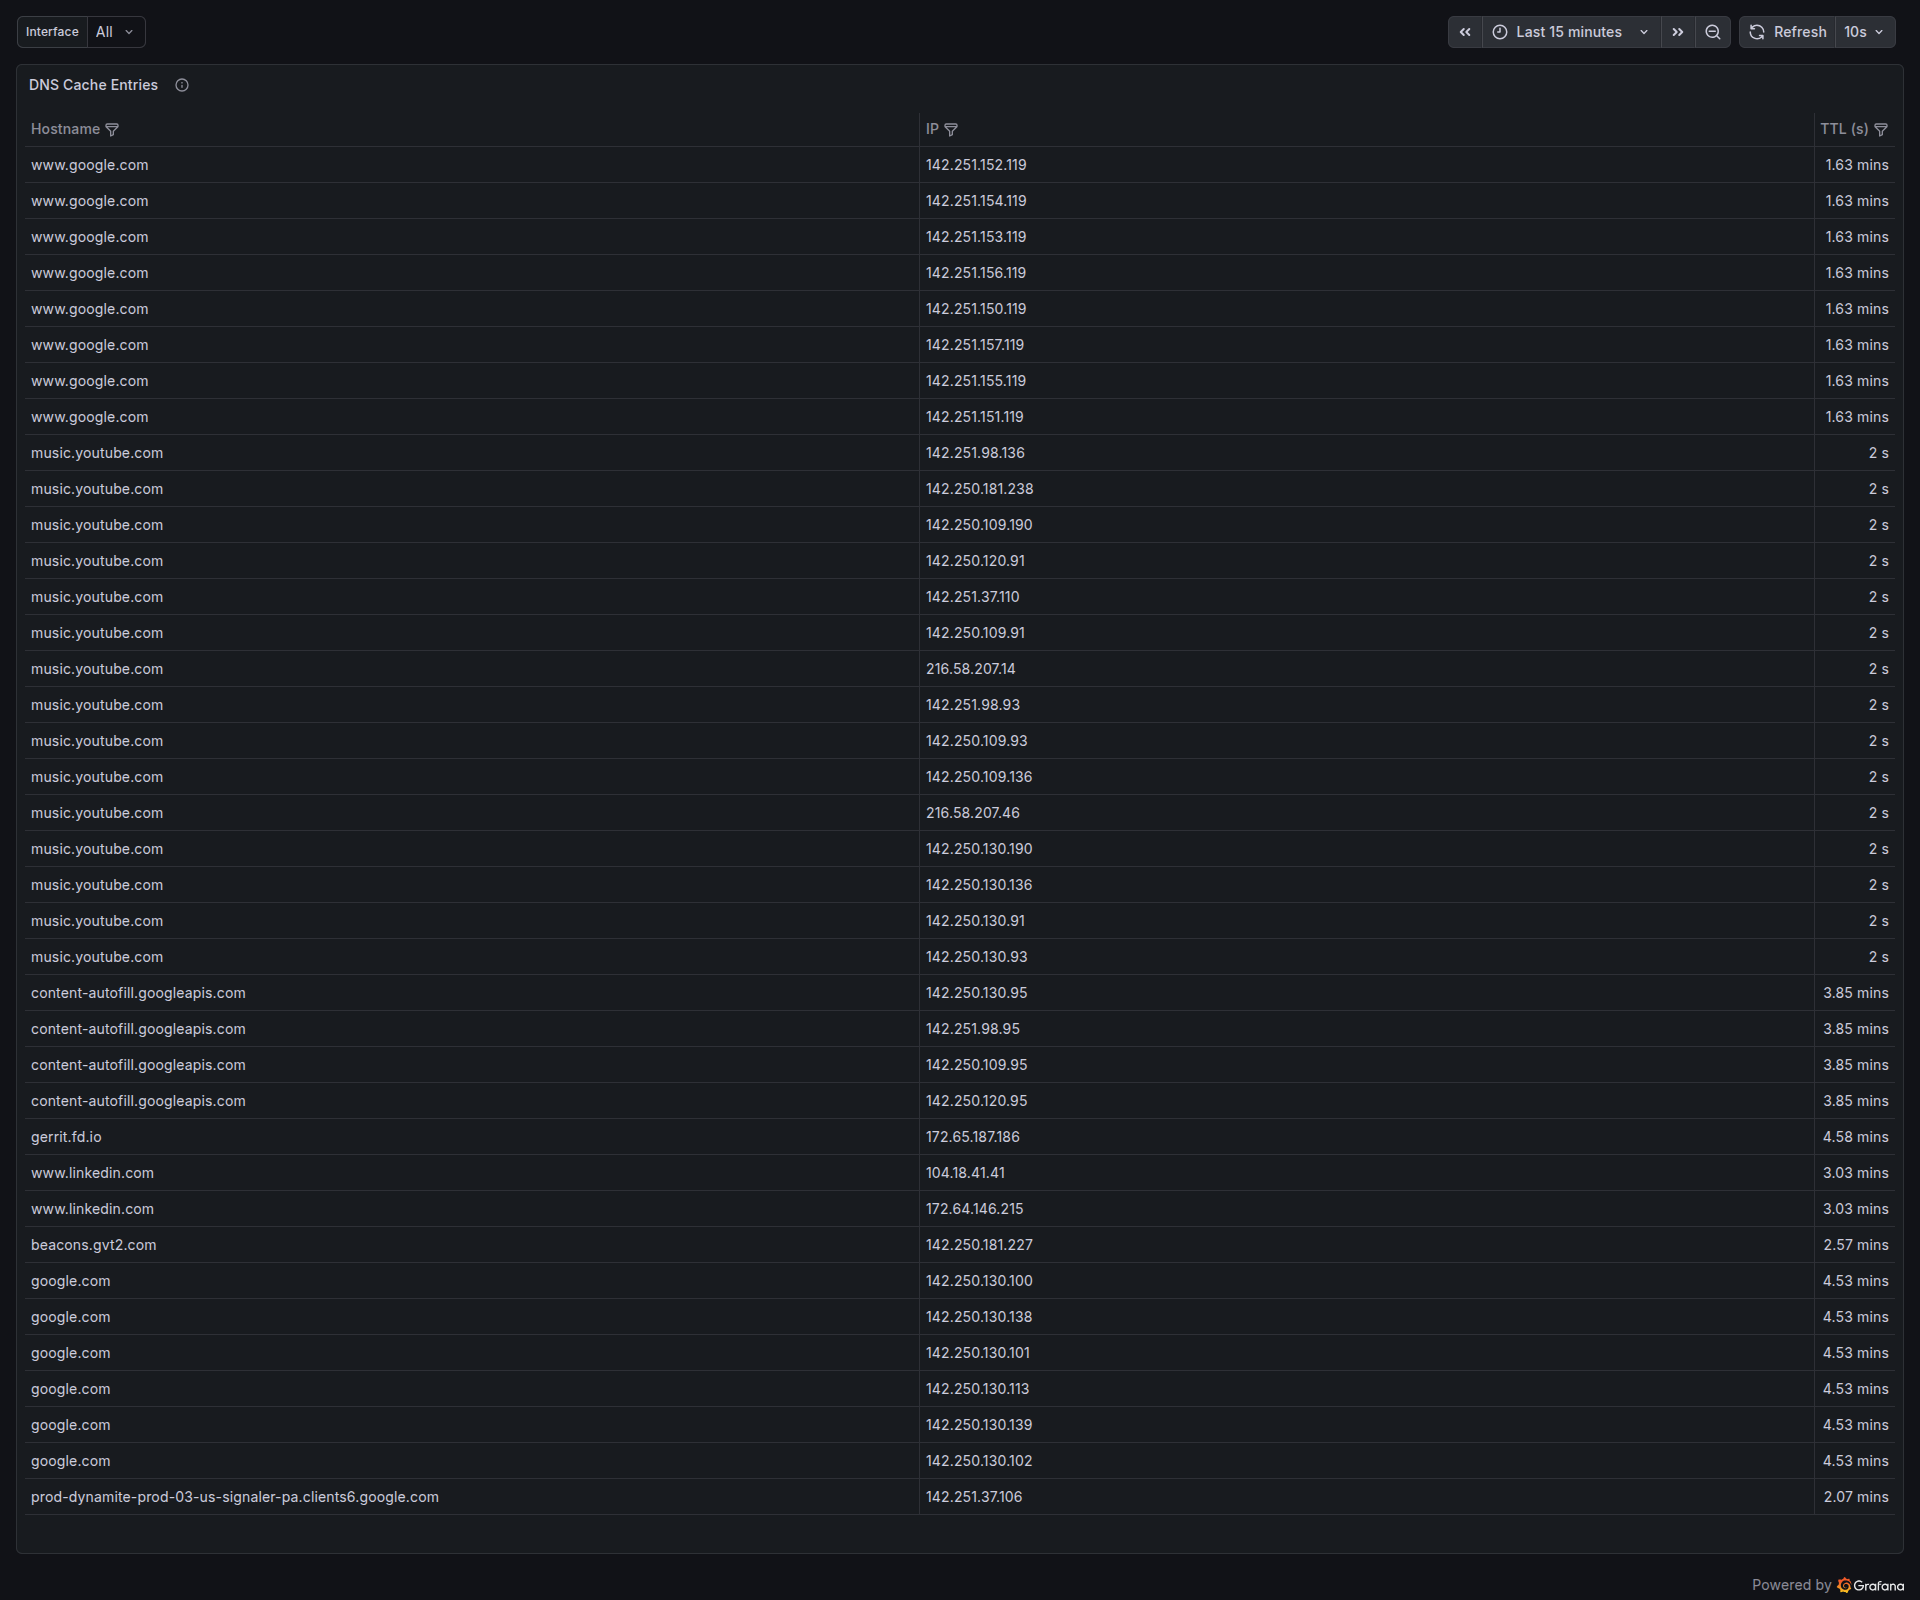
Every A response that crosses the interface is parsed and inserted into a 512-slot IP→hostname cache with TTL-based expiry. When any new flow lands on a destination IP, that IP is looked up against the cache. If there’s a hit, the hostname either confirms the existing verdict or overrides it.
Here’s a minute of the cache in real time — Google’s A records for www.google.com cycling through eight addresses, YouTube Music’s short-TTL edge addresses churning every couple of seconds, a long-lived gerrit.fd.io entry with four-and-a-half minutes to go:
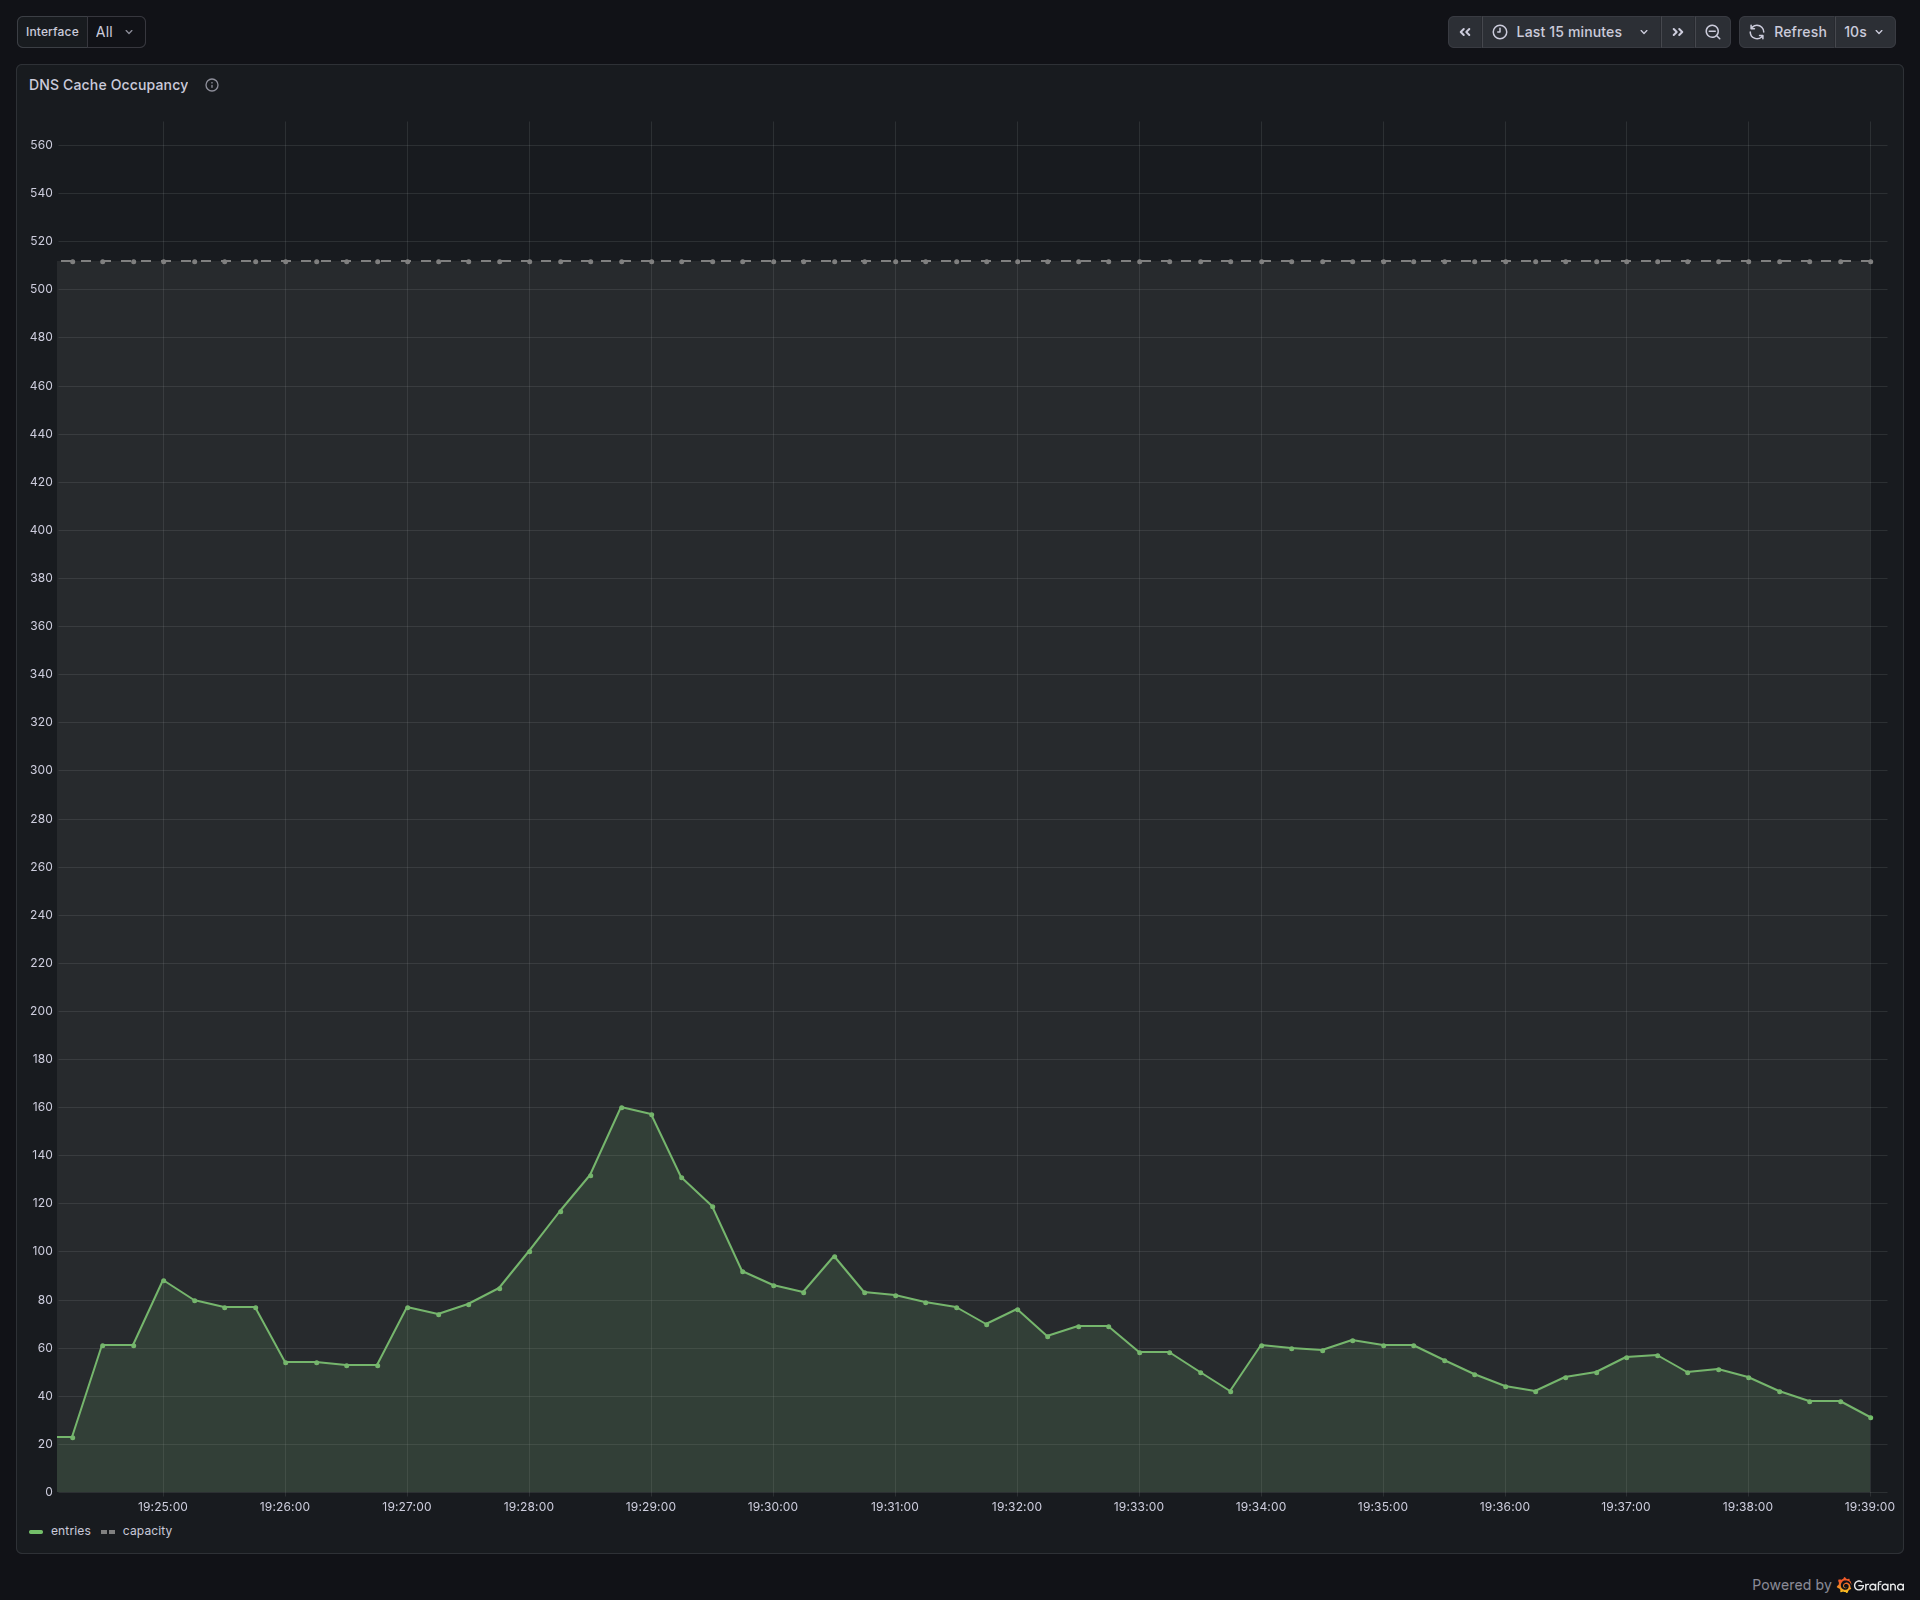
The cache itself is bounded and self-cleaning. With active browsing the occupancy hovers around a hundred entries, spiking higher during bursts (a YouTube page that pulls down a dozen asset shards at once) and decaying back to zero as TTLs expire:
Traffic categories for operators
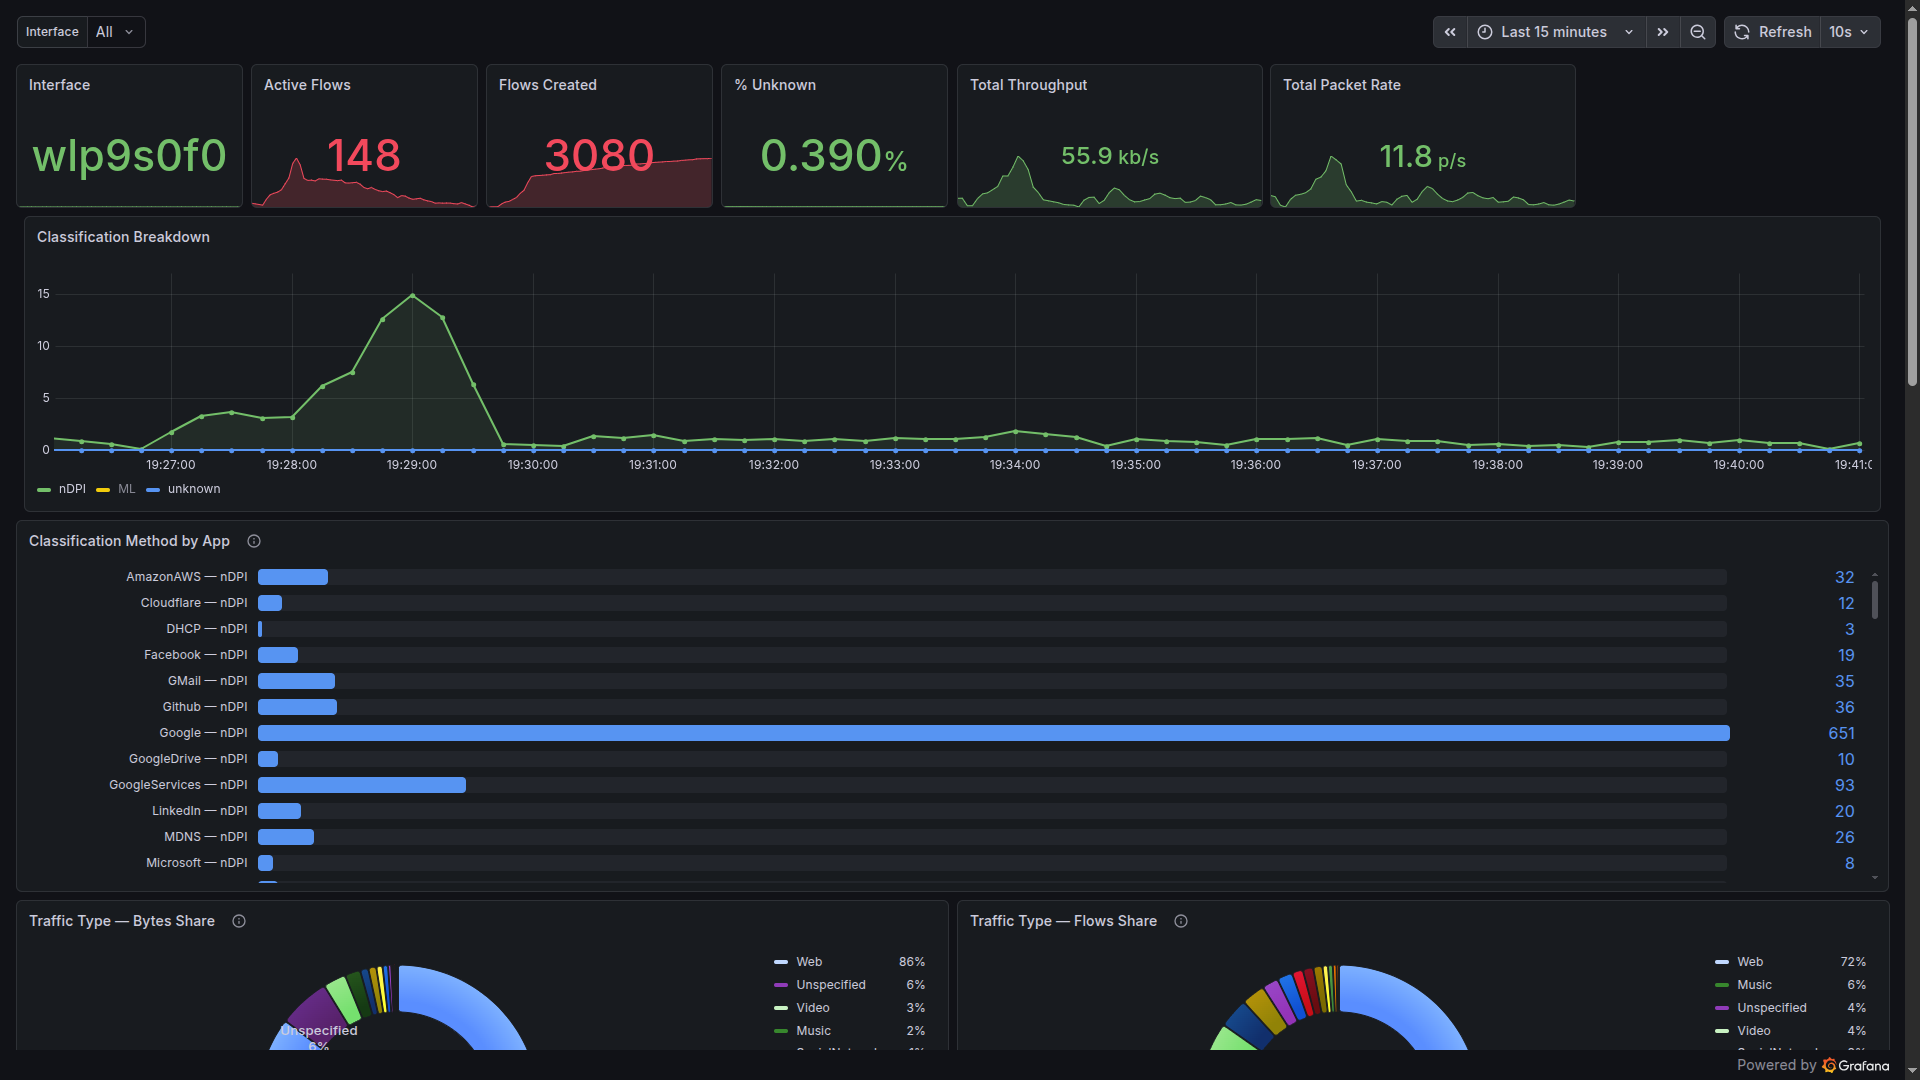
nDPI comes with a category taxonomy bolted onto its protocol database — Video, VoIP, Chat, Mail, CDN, Music, Social Network, and so on. PacketLens aggregates bytes and flows per category, so the dashboard can answer “what kind of traffic is my network carrying” in one glance, rather than forcing an operator to read through a list of 50 applications:
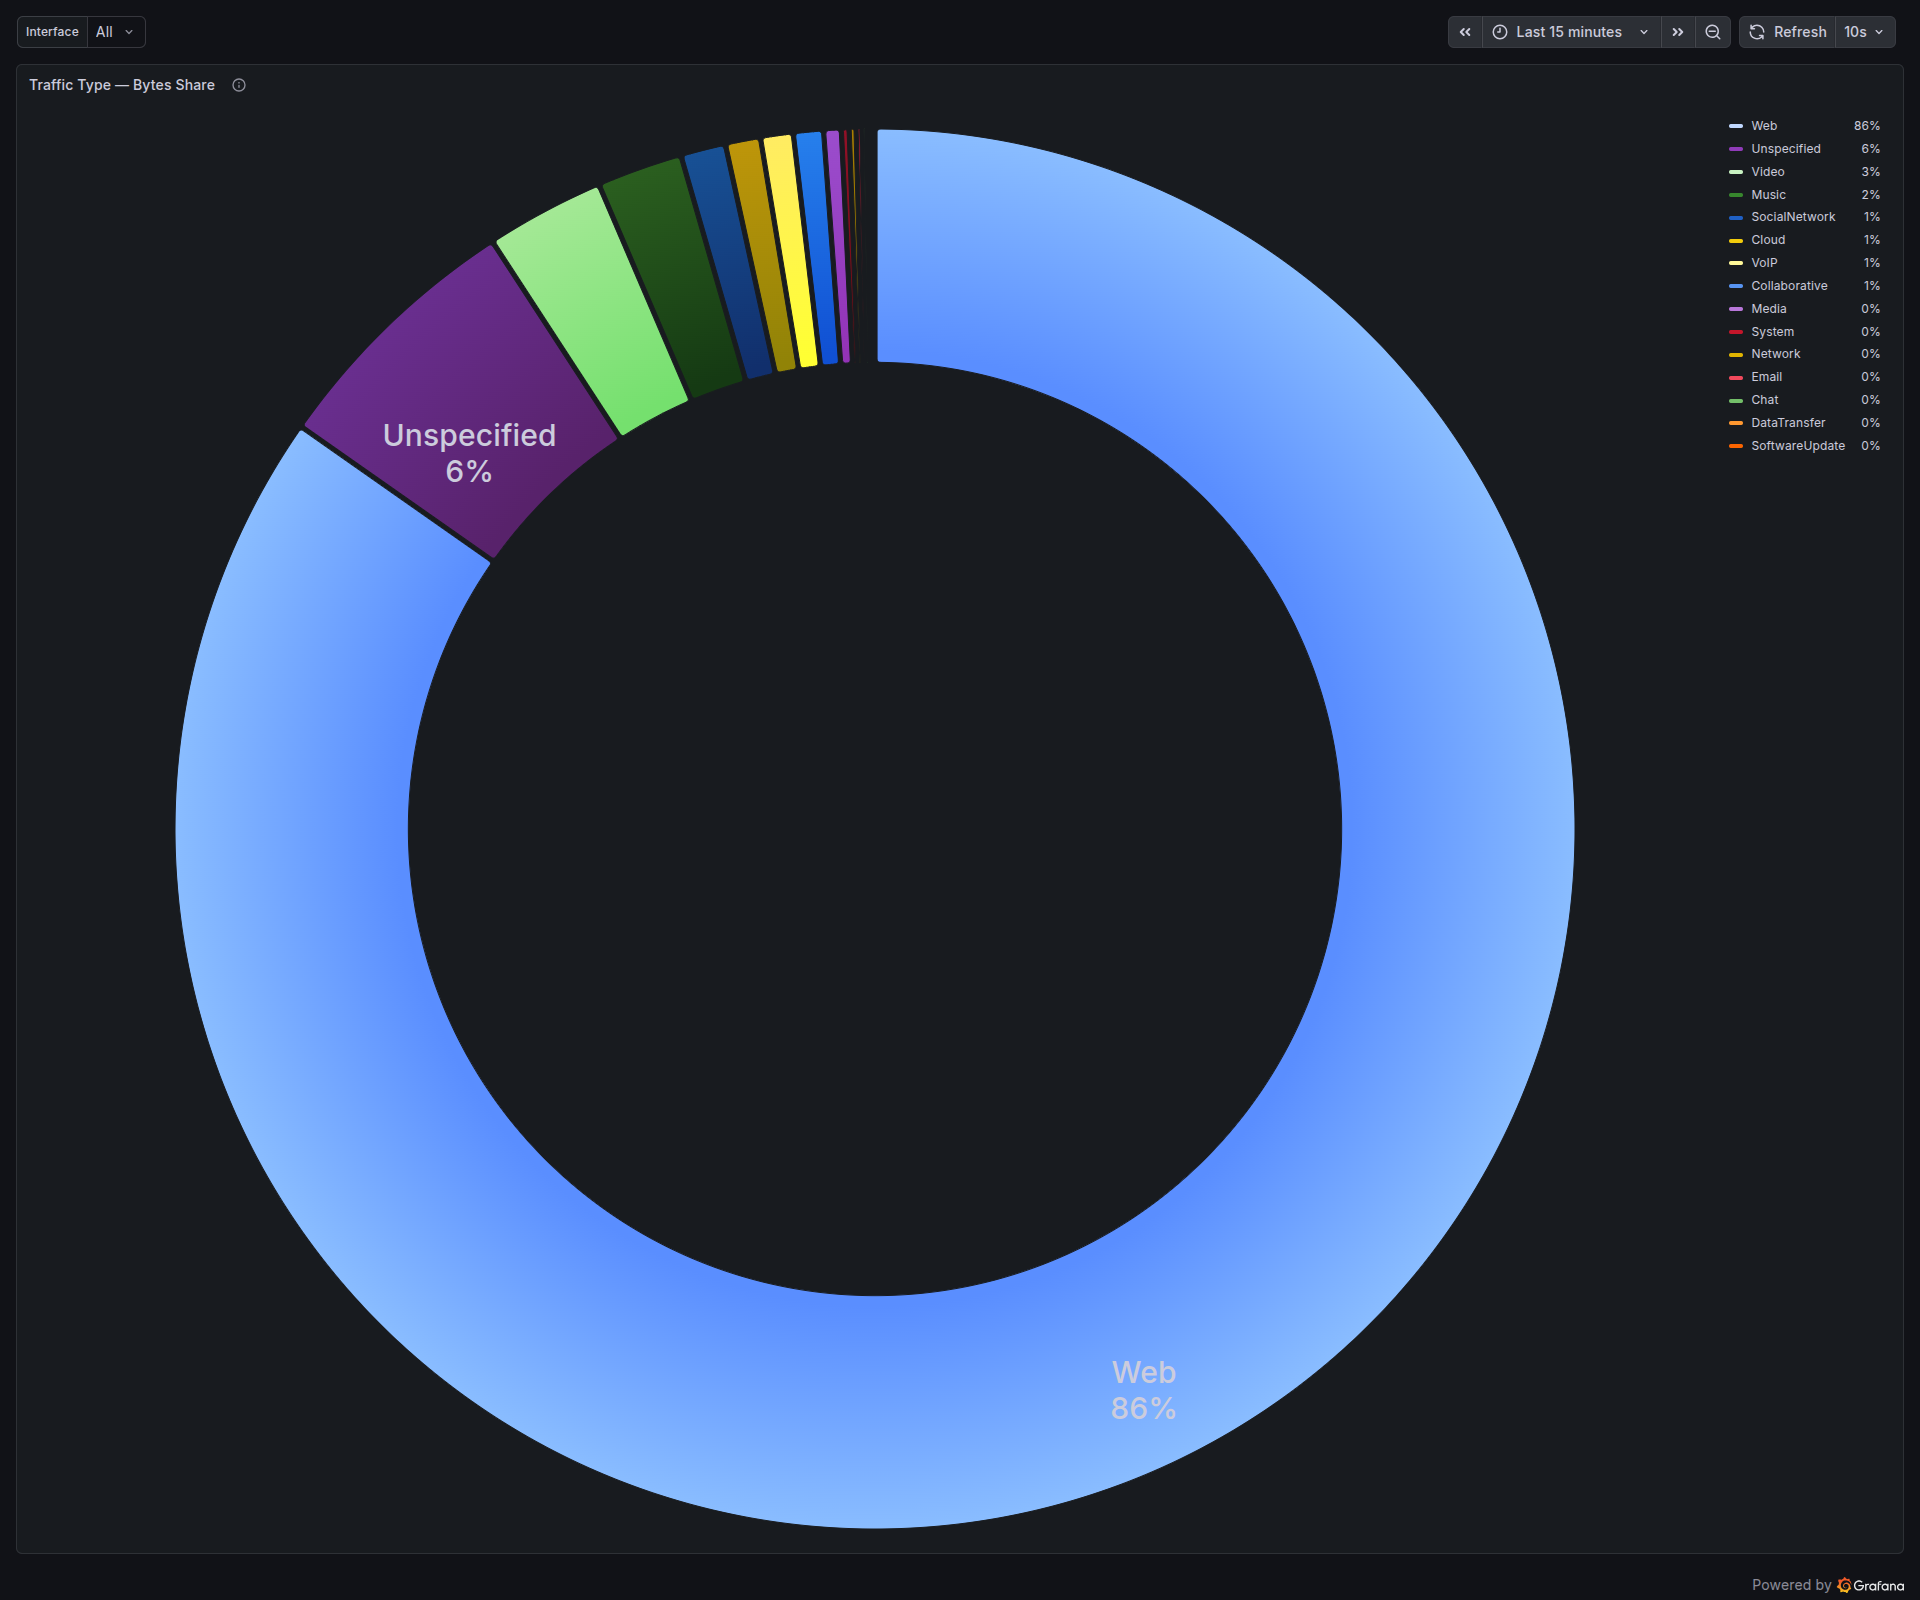
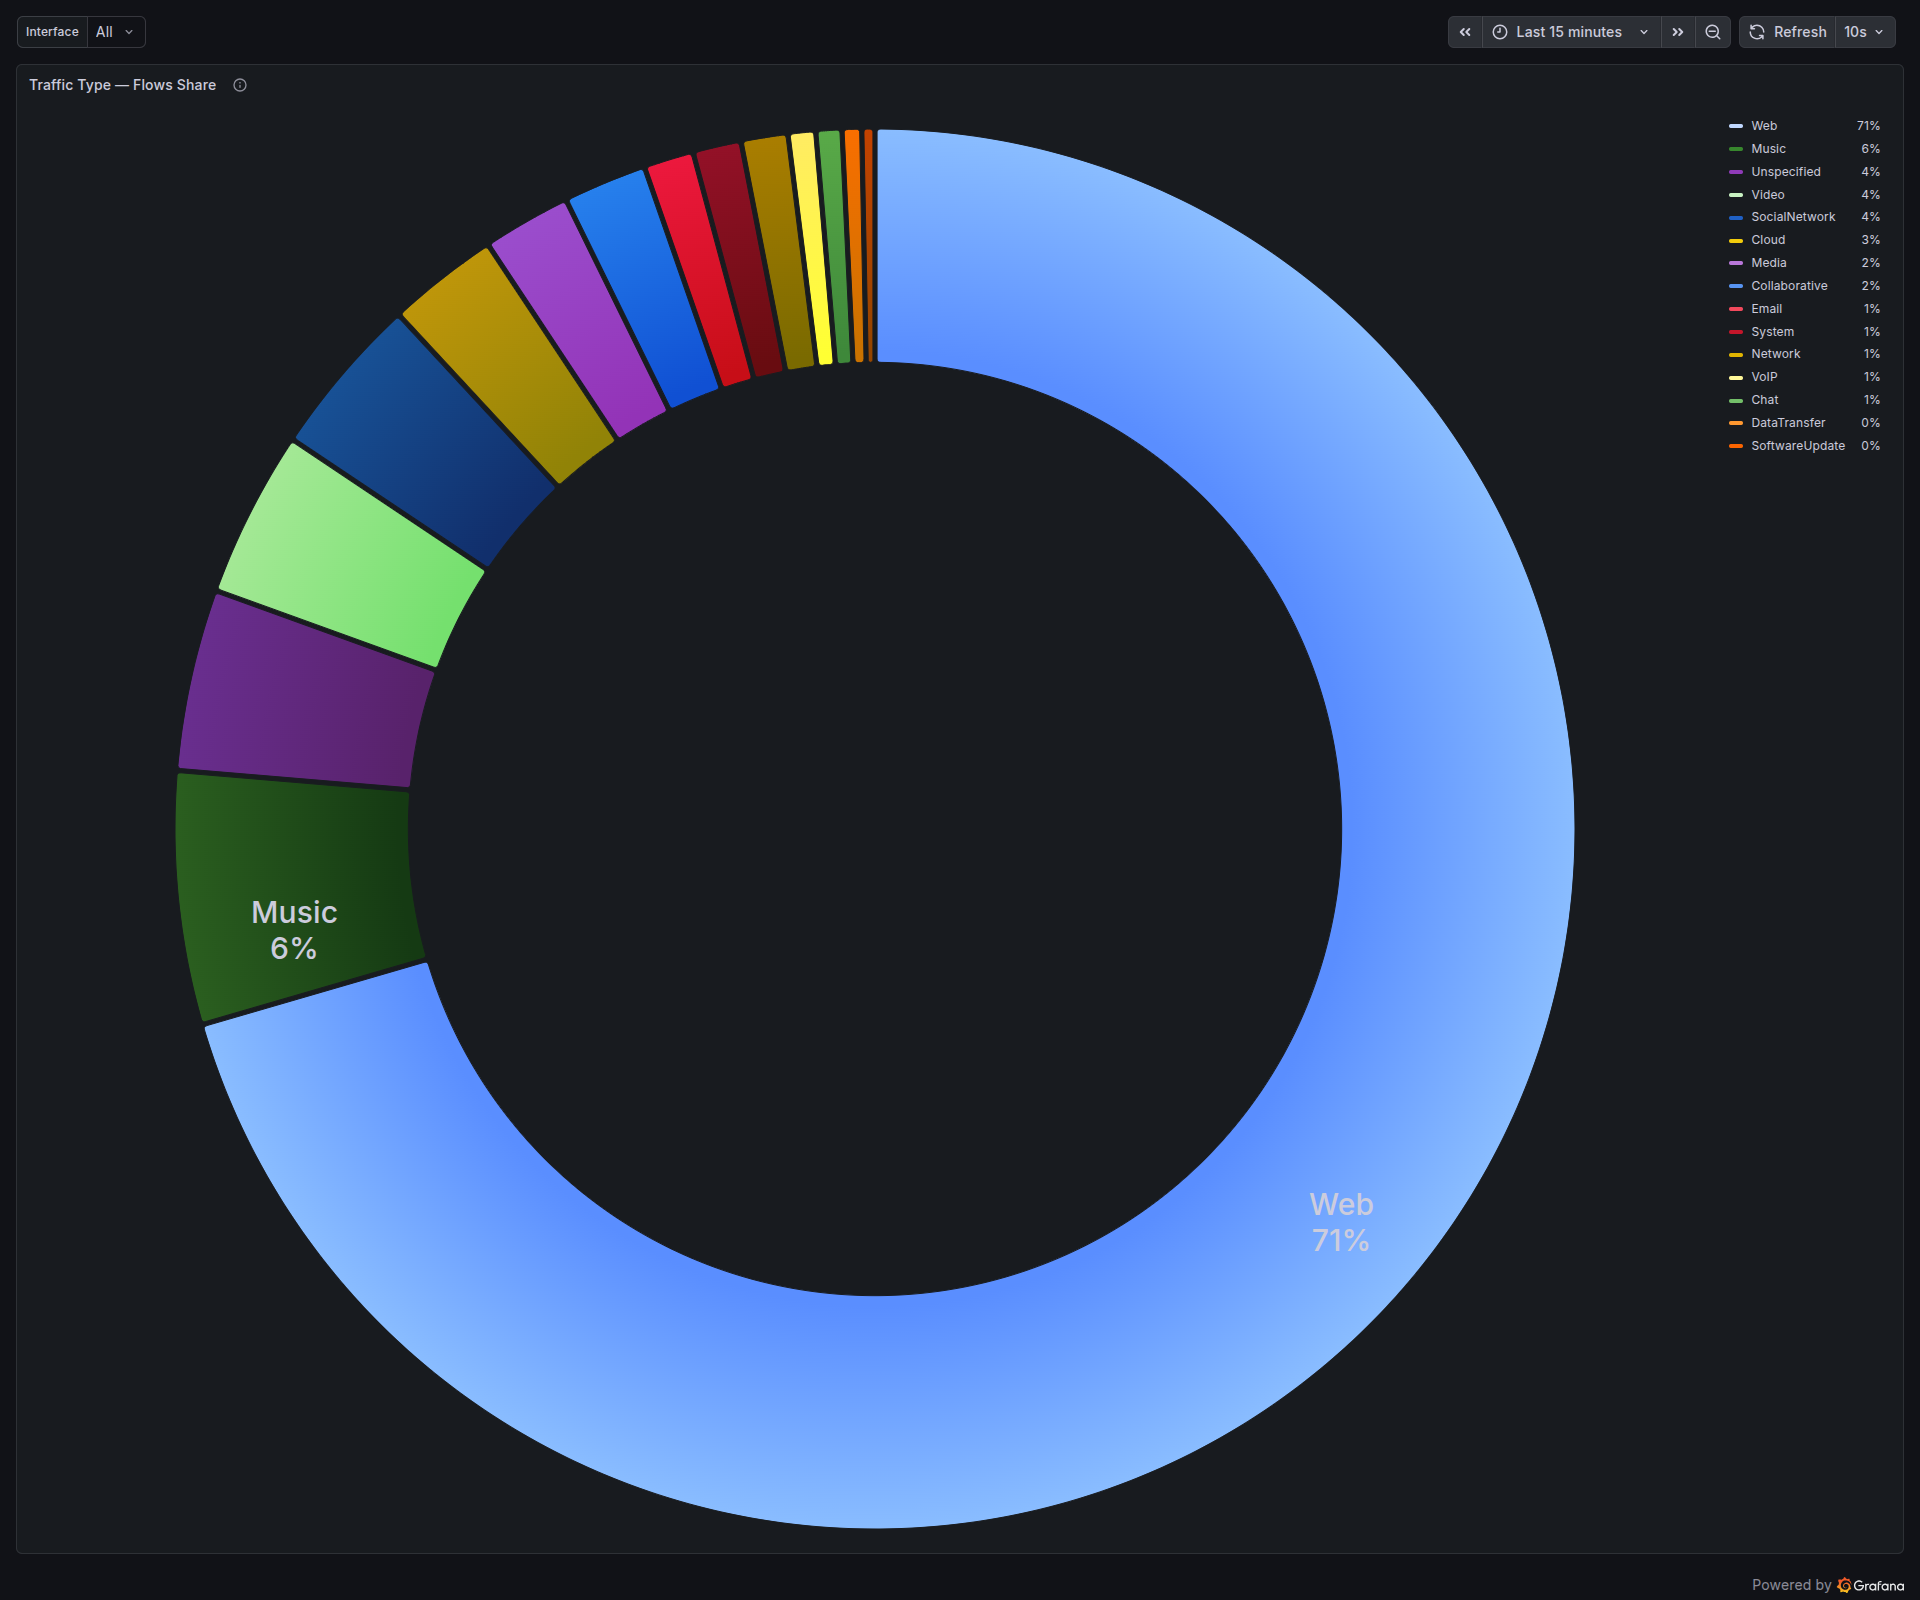
The two pies tell different stories on purpose. Bytes show where bandwidth is going; flows show where session count is going. A VoIP call is one bidirectional flow with steady low throughput. A Netflix stream is a handful of flows with huge throughput. A modern social-media feed is dozens of flows, each tiny. Looking at both at once keeps the operator honest.
The top-line view
For day-to-day visibility, the stat row at the top of the dashboard gives a laptop-engineer-at-a-glance summary: which interface, how many flows are currently open, how many have been seen since boot, what percentage the classifier couldn’t figure out, and the throughput and packet rate right now.
The one that deserves a second look is the “% Unknown” gauge. On this capture, with the full pipeline running, it sits at 0.39%. That figure is the fraction of flows that none of the four stages could place. It covers things like bespoke enterprise protocols, malformed handshakes, and the long tail of genuinely unclassifiable traffic. Everything else — every regular web browse, every AI prompt, every Spotify track, every DNS lookup, every MDNS broadcast — got a name.
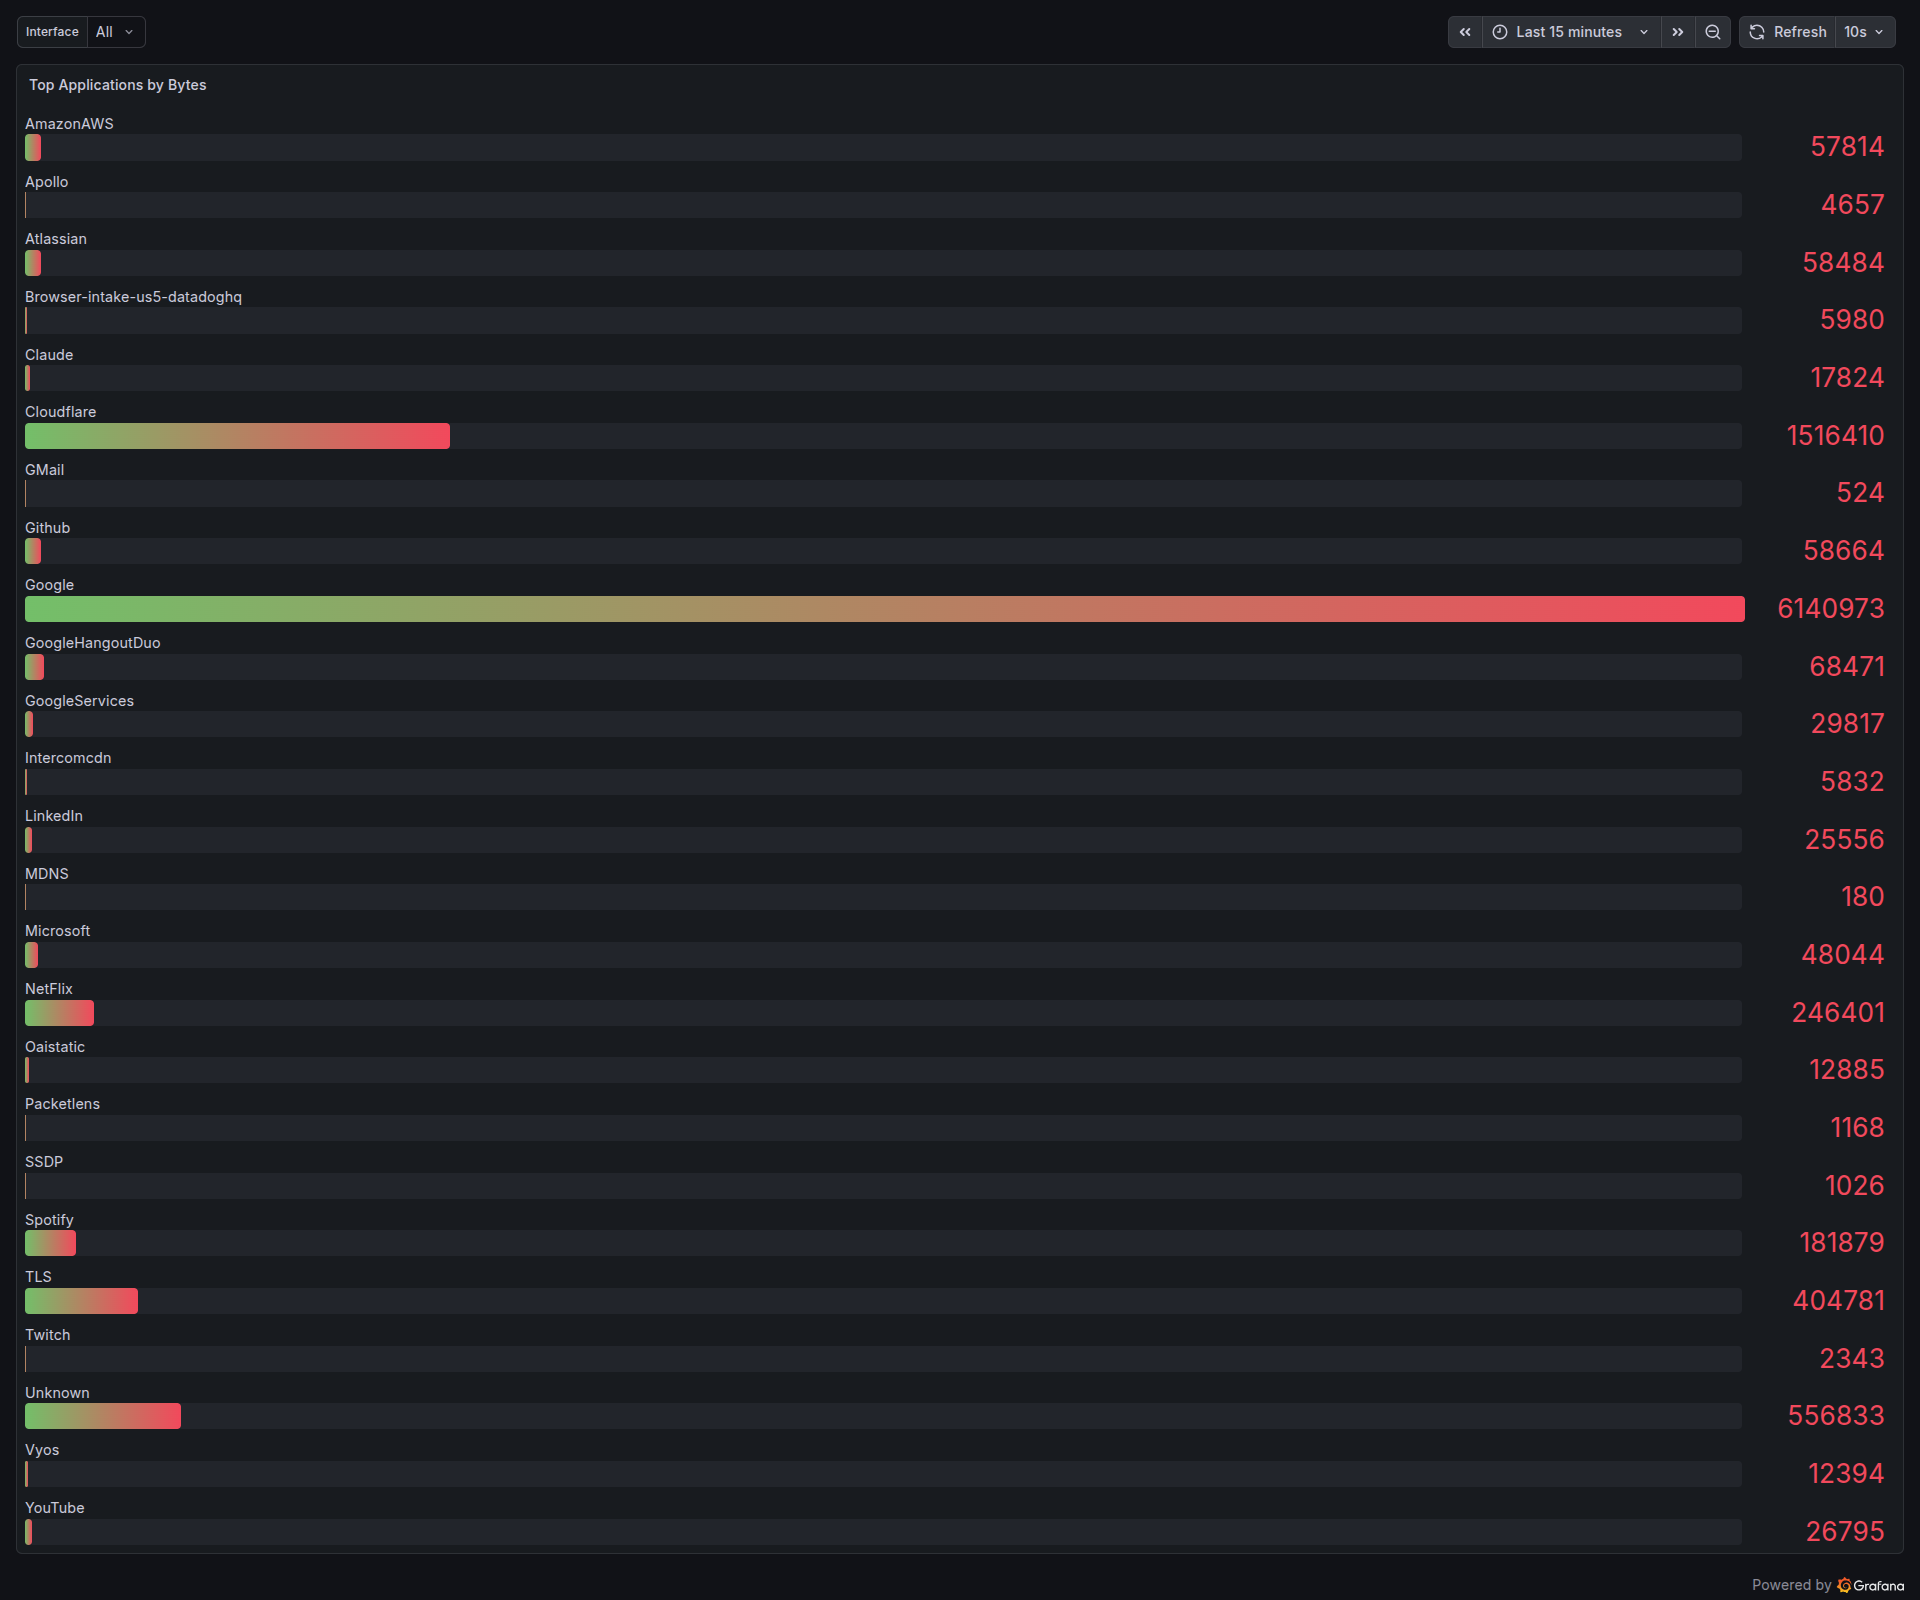
And for capacity planning, the usual “what are the heaviest talkers on my wire right now” question is answered with a simple per-app byte counter:
Running inside VPP
Everything above — the multi-stage classifier, the SNI table, the DNS cache, the Prometheus metrics, the Grafana dashboard — is designed to run inside FD.io VPP, the same packet-processing framework Cisco, Ericsson, and a long list of ISPs use for 100G to 800G forwarding. PacketLens registers as a feature-arc node on ip4-unicast, so classification happens on the same CPU core as the forwarding path, with under 8 ns of overhead per cached packet after the initial classification burst.
That means the Grafana dashboard on this blog post is not an “observability tool” sitting next to your router. It’s the same dashboard, driven by the same metrics, but exported directly from VPP’s stats segment via Prometheus. No mirror port. No dedicated appliance. No per-Gbps license. The classification pipeline runs inline at line rate, and the operator just opens Grafana.
If you’re running VPP and want PacketLens wired directly into your data plane — classifier, SNI product detection, DNS verification, and the Grafana dashboard shipped as a package — get in touch.